In our October newsletter, we introduced Qlikview as a means of being able to graphically represent your General Ledger reports. Well Qlikview can do (much, much) more than just report on GL. It can also be used to chart your sales, purchases or stock levels in any way that you want: as a data grid to the screen, as a bar chart, pie chart, report, Excel spreadsheet or many other graphical outputs.
 A number of our sites are now using Qlikview to overlay their WinMAGI data to help them with various management decisions and track their performance. Users are able to amend how their data is represented and what data is loaded. Please contact us if you would like to see some examples of Qlikview in action.
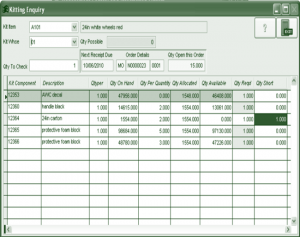 Sales Order Kitting allows you to enter in a finished item (the kit item) as a sales order line and the system will automatically create the lines for all of the kit components. You don’t need to enter in a line for each component; the system will do it for you. Also, if you are receipting a kit item, rather than updating the stock on hand of the finished item, the purchase receipt process will update the stock of the components that make up the kit. Kitting is a simple, easy way of being able to enter orders, control stock, and ensures that you are not sending out kits with missing components. For those that are interested, we have a more detailed user document that we can arrange to send to you.