Can you age your existing stock?

Qlikview can be used to review the quantities, value and age of your stock and sales over a nominated 12 month period. You can use the ageing data to see whether there are any unexpected patterns in your stock holdings and whether you can better plan your stock usage into the future.
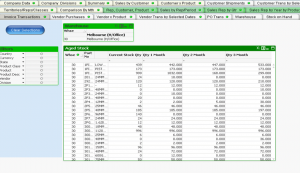
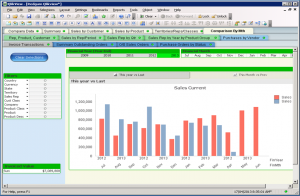
Qlikview DecYou can also see how old the stock items are so that you can use up your oldest stock before using your more recent stock or investigate why you have old stock sitting in your warehouse. Also compare this year to prior year sales values to highlight any trends.
Make better decisions

In our October newsletter, we introduced Qlikview as a means of being able to graphically represent your General Ledger reports. Well Qlikview can do (much, much) more than just report on GL. It can also be used to chart your sales, purchases or stock levels in any way that you want: as a data grid to the screen, as a bar chart, pie chart, report, Excel spreadsheet or many other graphical outputs.

Qlikview NovA number of our sites are now using Qlikview to overlay their WinMAGI data to help them with various management decisions and track their performance. Users are able to amend how their data is represented and what data is loaded. Please contact us if you would like to see some examples of Qlikview in action.

Introduction

QlikviewAs they say, a picture is worth a thousand words. Our QlikView offering now includes being able to graphically represent your existing General Ledger Financial reports. With a “one off” initial minor setup change, all of your existing locally developed GL reports can be charted, graphed, reviewed and exported. If you make a further change to your local reports, when you rerun the QlikView process, those changes will be reflected.