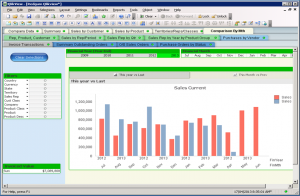
In our October newsletter, we introduced Qlikview as a means of being able to graphically represent your General Ledger reports. Well Qlikview can do (much, much) more than just report on GL. It can also be used to chart your sales, purchases or stock levels in any way that you want: as a data grid to the screen, as a bar chart, pie chart, report, Excel spreadsheet or many other graphical outputs.
 A number of our sites are now using Qlikview to overlay their WinMAGI data to help them with various management decisions and track their performance. Users are able to amend how their data is represented and what data is loaded. Please contact us if you would like to see some examples of Qlikview in action.